
Critical value is a term used in statistics that refers to a threshold or cutoff point for rejecting the null hypothesis during a test. A null hypothesis is a statement that says there is no significant difference between a sample statistic and a population parameter or between two or more groups in a population. Critical value plays a vital role in deciding whether to reject or not reject the null hypothesis during statistical analysis.
Critical value depends on the level of significance, the degree of freedom, the statistical test used, and the sample size or power. The level of significance (or alpha) is a predefined probability level that sets the standard for rejecting or accepting the null hypothesis. The most common levels of significance are 0.05 and 0.01, which represent a 5% and 1% chance of rejecting the null hypothesis respectively.
This article is all about critical value. Here, we will discuss the definition and types of critical value. We will learn how to find its values through examples.
Definition of Critical Value
The critical value serves as a benchmark in hypothesis testing that compares with test statistics to determine whether to reject or not reject a null hypothesis. The null hypothesis could not be rejected if the test statistic is smaller than the critical value. Conversely, reject the null hypothesis and accept the alternative hypothesis if the test statistics are larger than a critical value.
In simpler terms, the critical value splits the distribution graph into the null and rejection regions for a hypothesis test. The null hypothesis is rejected at the selected significance level when the test statistic value lies within the rejection region; otherwise, it is not rejected.
Critical value testing can include:
One-tailed test
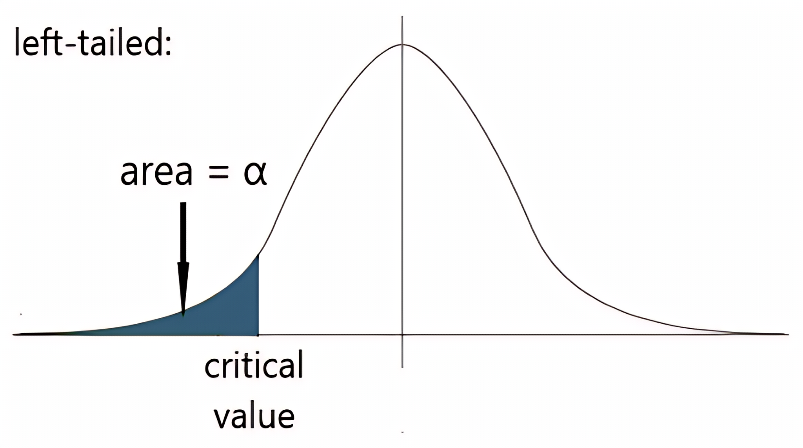
In a one-tailed test, there is only one rejection region (either on the right tailor on the left tail of the distribution) and one critical value. In a left-tailed or lower-tailed test, both the critical value and rejection region are located on the left side of the distribution.
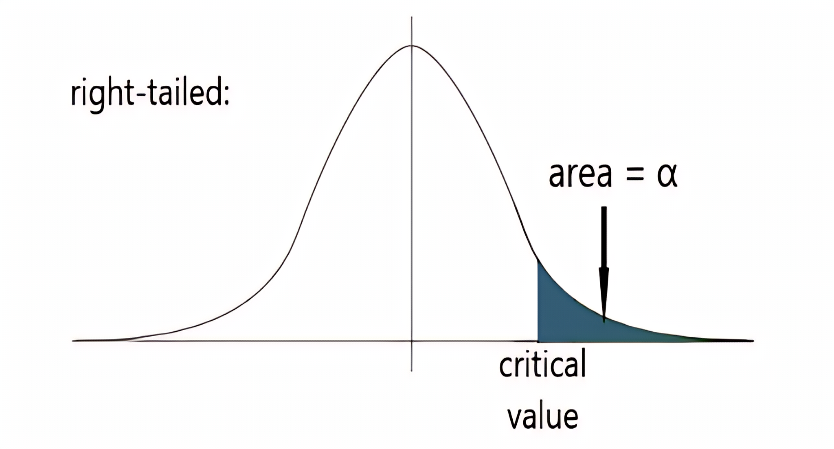
Conversely, in the right-tailed or upper-tailed test, the critical value and rejection region are positioned on the right side of the distribution.
Two-tailed test
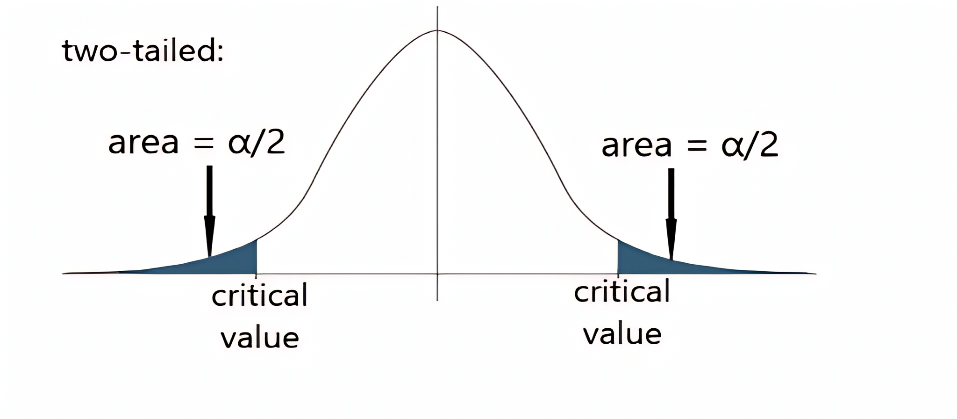
Two-sided hypothesis tests consist of two rejection regions. Therefore, we will require two critical values that define these regions. To do this, we divide the significance level in half part. This split assigns a probability of α / 2 to each rejection region. The critical values of the test statistic are located on both the left and right sides of the distribution.
Types of critical value
Here are three common types of critical values:
- Z- Critical value
- T- Critical value
- F- Critical value
Z-Critical Value:
The Z-critical value is used in hypothesis testing with normally distributed data (when the sample size is greater or equal to 30). It represents the threshold on the standard normal distribution used to decide whether to reject or accept the null hypothesis.
How to find z-critical value?
Below are a few steps of finding z critical value.
- Identifying the desired significance level (α) is the first step in finding the z-critical value.
- For a two-tailed test, subtract α from 1. For a one-tailed test, minus α from 0.5.
- Locate the resulting value on the z-table.
- Add the corresponding values from the upper row and leftmost column intersecting at the located value on the z-table to get the z-critical value.
T-Critical Value:
The T-critical value is used in hypothesis testing when the data is not normally distributed or the sample size is less than 30. It comes from the t-distribution of the student, which has “degrees of freedom” based on the sample size.
How to find t-critical value?
Below are a few steps of finding t critical value.
- The first step is to identify the significance level (α).
- For a two-tailed test, divide alpha by 2. Alpha will remain the same for the one-tailed test.
- Determine the degree of freedom df by subtracting 1 from the sample size (n).
- Use the t-distribution table and locate the degree of freedom on the leftmost column and alpha on the top row.
- The intersection of this row and column will be our t-critical value.
F-Critical Value:
The F-critical value is used in F-tests to compare the variances of two normal populations. It comes from the F-distribution that has two degrees of freedom based on the sample sizes of the two populations.
How to find F-critical value?
Below are a few steps of finding f critical value.
- Start by identifying the level of significance.
- Obtain numerator degrees of freedom by subtracting 1 from the first sample size (n). Also, subtract 1 from the second sample size to get denominator degrees of freedom.
- Use the f-distribution table and find the numerator degree of freedom on the leftmost column and the denominator degree on the top row.
- The intersection of the numerator and denominator value will be the f-critical value.
Solved Examples of Critical Values
Let’s learn how to find different types of critical value with the help of practical examples.
Example:
Calculate the z-critical value for a right-tailed test when the significance level is 0.09
Solution:
Step 1: Identify the significance level or alpha.
α = 0.09
Step 2: Minus α from 0.5, as it is a one-tailed test.
0.5 – 0.09 = 0.41
Step 3: Search the value 0.41 in the z-table.
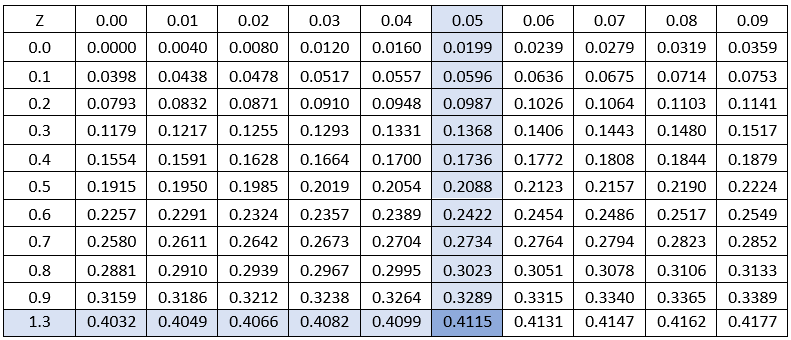
Add the intersecting value on the top row and most left column to get the z critical value.
1.3 + 0.05 = 1.35
Z-critical value = 1.35 for the right-tailed test.
Example:
Find a one-tailed t-critical value when the significance level of 0.025 and the sample size is 3.
Solution:
Step 1: Identify the significance level or alpha.
α = 0.025
Step 3: Determine the degree of freedom df by subtracting 1 from the sample size (n).
df = 3 – 1 = 2
Step 4: Use the t-distribution table and locate the degree of freedom on the leftmost column and alpha on the top row
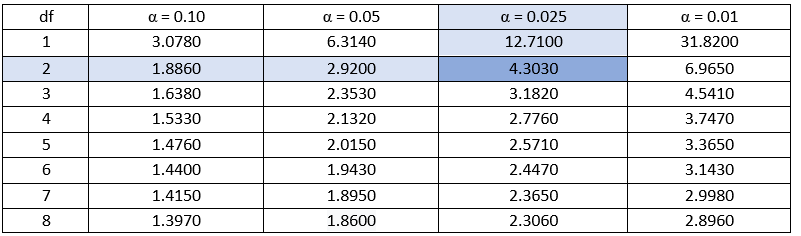
Thus, df and α intersect at 4.303, so 4.303 is the t-critical value.
Summary
In this article, we have explained the critical value concept by explaining its definition. We learned about one-tailed and two-tailed tests with their graphic representation. We have studied various types of critical values and learned how to calculate them accurately through many examples